Data-flow models are an intuitive way of showing how data is processed by a system. At the analysis level, they should be used to model the way in which data is processed in the existing system. The use of data-flow models for analysis became widespread after the publication of DeMarco’s book on structured systems analysis. They are an intrinsic part of structured methods that have been developed from this work. The notation used in these models represents functional processing (rounded rectangles), data stores (rectangles) and data movements between functions (labelled arrows).
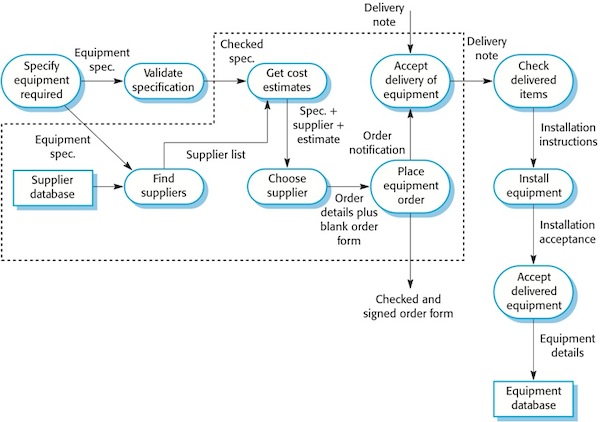
Figure 1 shows a data-flow diagram for equipment procurement. This illustrates the processing steps with the area bounded by dotted lines, showing the boundaries of the system to be implemented.
Figure 1. Data flow diagram of the equipment procurement process
Data-flow models are used to show how data flows through a sequence of processing steps. For example, a processing step could be to filter duplicate records in a customer database. The data is transformed at each step before moving on to the next stage. These processing steps or transformations represent software processes or functions when data-flow diagrams are used to document a software design. However, in an analysis model, people or computers may carry out the processing.
A data-flow model, which shows the steps involved in processing an order for goods (such as computer equipment) in an organisation, is illustrated in Figure 2. This particular model describes the data processing in the ‘Place equipment order’ activity in the overall process model shown in Figure 1. The model shows how the order for the goods moves from process to process. It also shows the data stores (Orders file and Budget file) that are involved in this process.
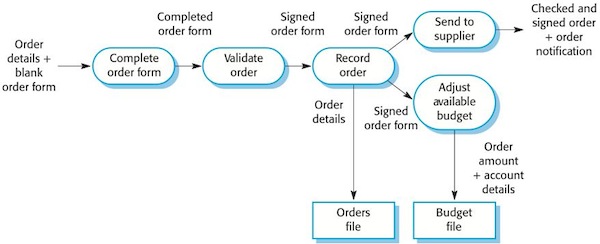
Figure 2. Data flow diagram of order processing
Data-flow models are valuable because tracking and documenting how the data associated with a particular process moves through the system helps analysts understand what is going on. Data-flow diagrams have the advantage that, unlike some other modelling notations, they are simple and intuitive. It is usually possible to explain them to potential system users who can therefore participate in validating the analysis.
In principle, the development of models such as data-flow models should be a ‘top-down’ process. In this example, this would imply that you should start by analysing the overall procurement process. You then move on to the analysis of sub-processes such as ordering. In practice, analysis is never like that. You learn about several different levels at the same time. Lower-level models may be developed first then abstracted to create a more general model.
More on data-flow diagrams from the UK Open University